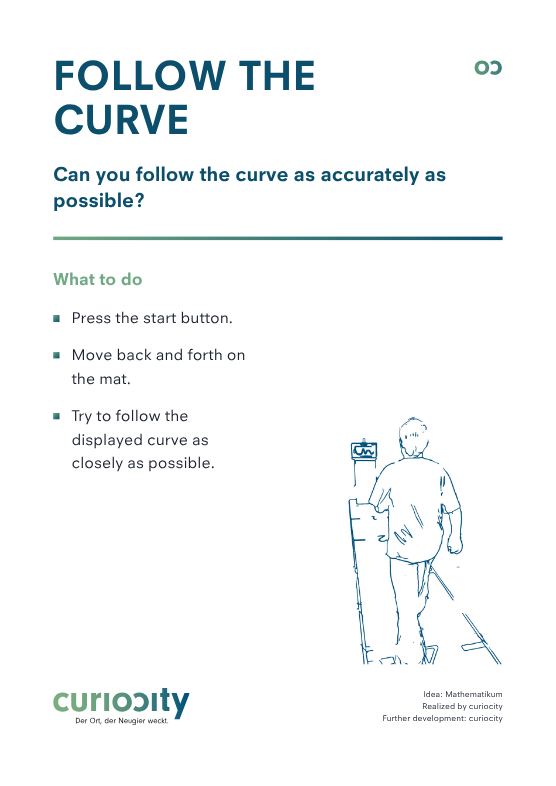
Follow the Curve
Can you follow the curve as accurately as possible?
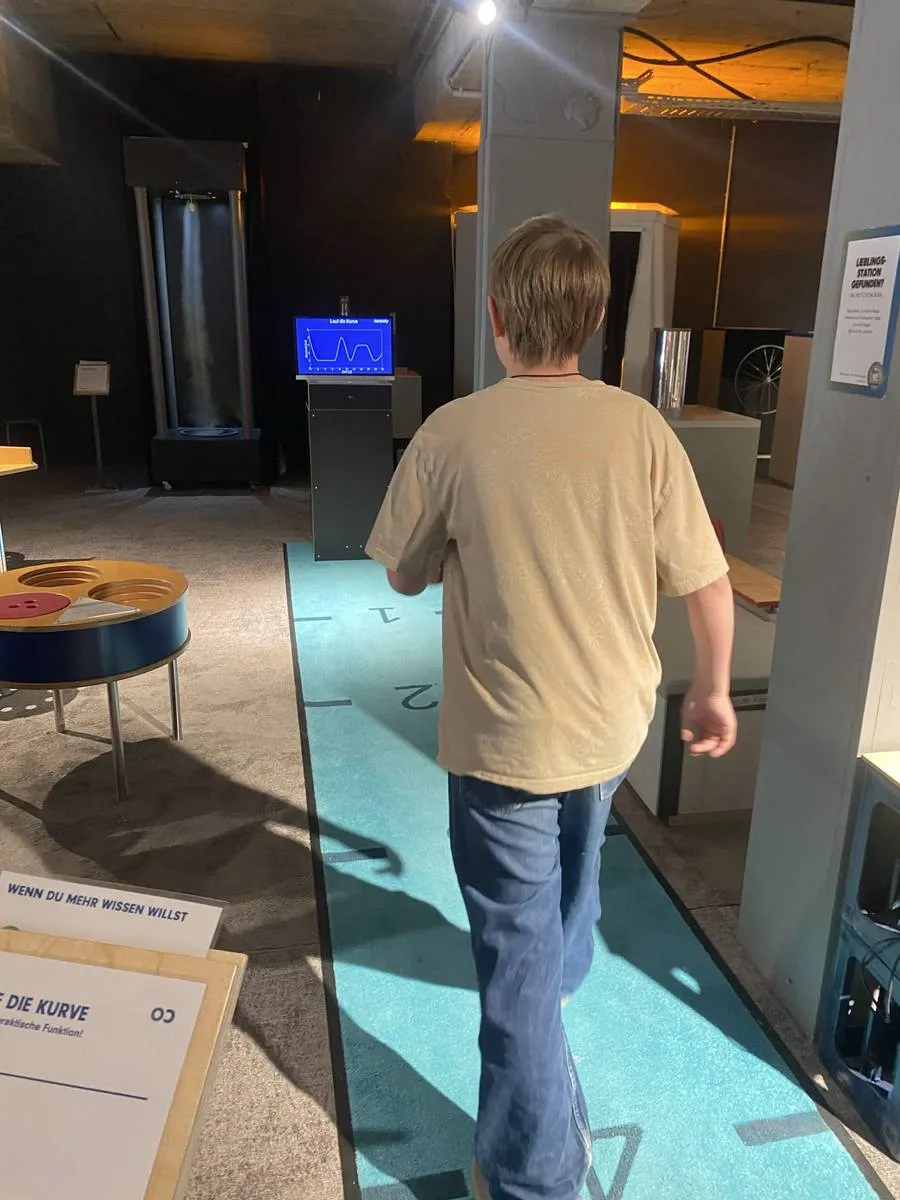
Your movement is displayed as a curve in real time. This shows how physicists use graphs to describe and analyze motion.
The Science Behind It
The sensor measures your distance from the box and converts it into a signal. The signal is displayed as a graph on the screen. The horizontal axis shows time, and the vertical axis shows your distance. This creates what is known as a distance-time graph. Every movement you make is translated into a curve. If you move quickly, the curve rises or falls steeply. If you move slowly, it is flatter. If you stand still, the line is horizontal. These displays help make motion visible and comparable. They are used in physics, engineering, and everyday life to describe speeds, processes, or changes over time.